Thermal Drone Inspection for Solar Farms: What Operators Should Expect from a Modern Program
How thermal drone inspection actually works at solar PV scale — defect detection rates, inspection economics, conditions that matter, and what to specify so the program produces actionable maintenance work, not just imagery.
Thermal drone inspection of solar PV is one of the cleanest examples of drone capture genuinely changing an asset-management workflow. The economics are favourable, the defect signatures are well-characterised, and the integration with existing O&M (operations and maintenance) processes is relatively straightforward. For solar farm operators, the question is no longer whether thermal drone inspection adds value — it is how to scope a program that produces actionable maintenance work, not just imagery.
This post is about what to expect from a modern thermal drone program on a solar farm, what conditions need to be in place for the data to be reliable, and where the technology fits inside a broader O&M strategy.
What thermal inspection actually finds
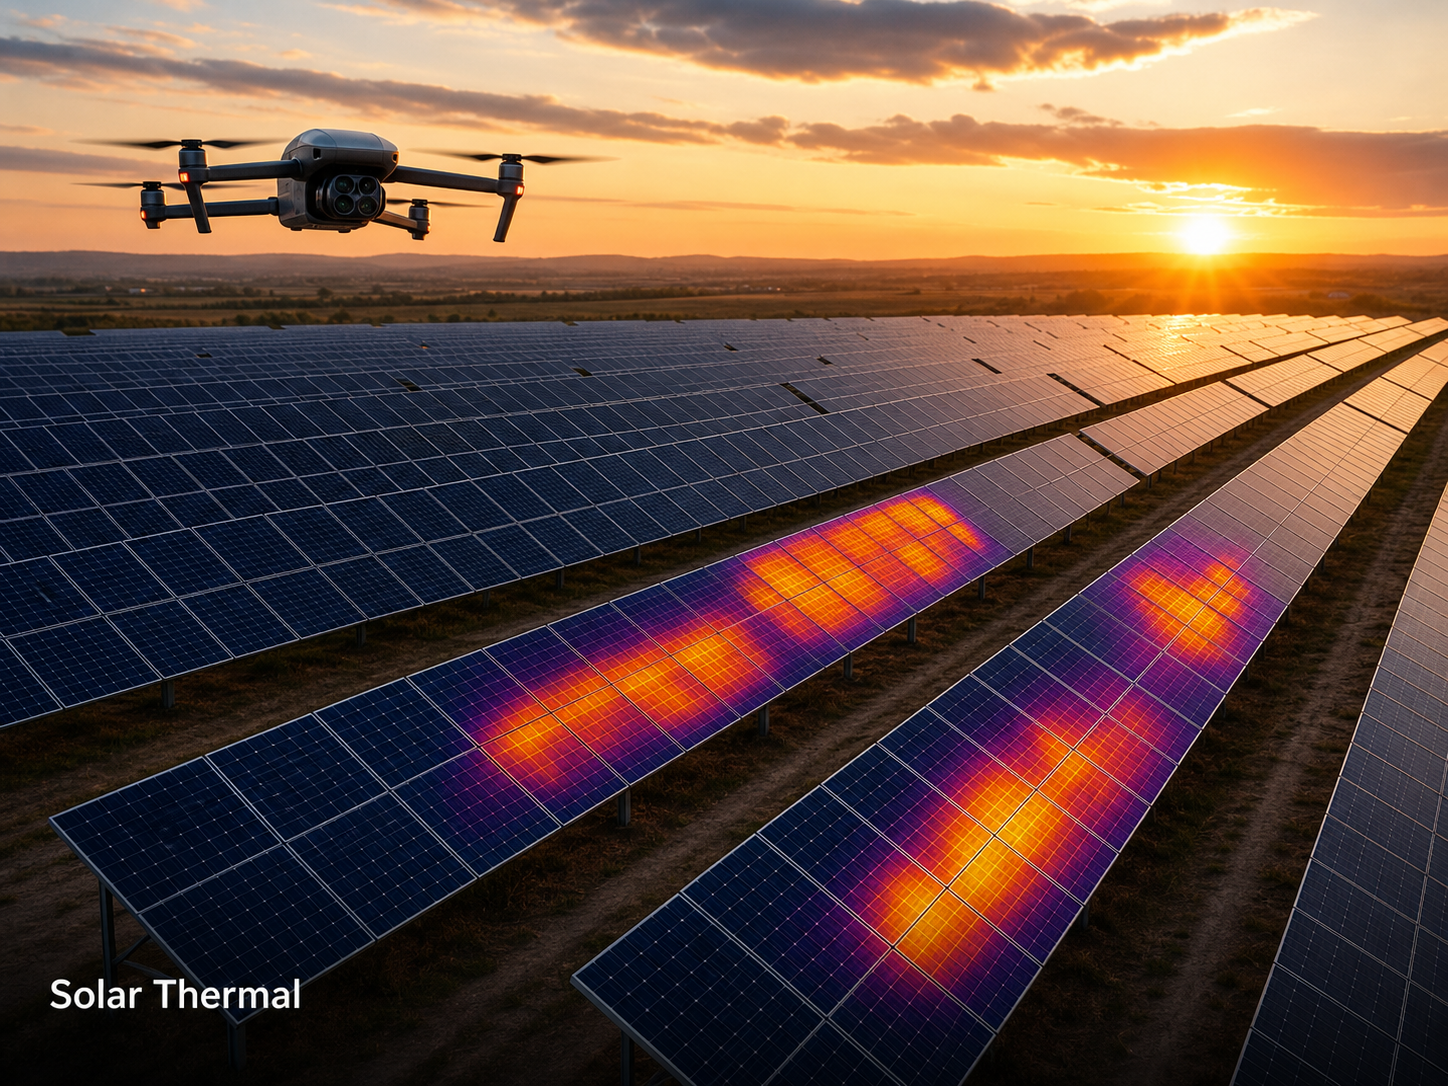
A thermal drone flight over a solar farm produces radiometric images of the panel surface. Defects that result in localised heating (or absence of expected heating) appear as anomalies against the surrounding panel temperature. The well-characterised defect signatures include:
- Hotspots: localised high-temperature anomalies, typically indicating cell-level failure, shading damage, or junction box issues.
- Bypass diode failures: distinctive patterns where a section of a module operates at elevated temperature because a diode has failed open or short.
- String outages: entire strings operating at a different temperature than adjacent strings, indicating connection or inverter-level issues.
- Soiling and shading effects: lower-temperature patterns that distinguish soiling from electrical fault.
- Micro-cracks and PID (potential induced degradation): progressive patterns visible thermally before they show up in performance data.
- Inverter and combiner box anomalies: balance-of-system thermal patterns picked up on the ground equipment.
Industry data on detection performance is consistent. Drone thermal inspections identify roughly 50% more defects than handheld sampling, with one published scan uncovering 3,200 anomalies across 7 categories, impacting 19,500 modules and causing 7.6 MW of production loss. The defects identified are predominantly recoverable through targeted O&M work — diode replacement, junction box rework, string re-termination, cleaning.
The inspection economics
The cost-and-time case for thermal drone inspection at solar scale is decisive. A modern setup using a DJI Matrice 350 RTK or equivalent can inspect a 20 MW solar farm in 2 to 4 hours, compared to roughly 500 hours (around 20 days) for manual inspection. A 100 MW farm scales similarly — 10 to 20 hours by drone, versus around 2,500 hours manually.
For program-level economics, Raptor Maps reported that drone inspections saved $788 million annually across PV systems in 2025, with drone solar adoption growing 45% from 2023 to 2024. Per-MW inspection cost has dropped substantially as the analysis software has matured and the flight automation has reduced pilot time per acre.
A useful operator-level reference: regular aerial thermographic inspection saves approximately $1,916 per MW per inspection compared to traditional ground inspection, with the savings compounding when production loss from undetected defects is included in the model.
Conditions that determine whether the data is reliable
Thermal inspection of solar PV requires specific operating conditions to produce reliable defect identification. The flight is the easy part; the conditions are where most programs either produce strong data or produce ambiguous imagery.
Irradiance: the panels need to be under meaningful production load to show thermal defects. The IEC 62446-3:2017 standard for thermographic PV inspection specifies a minimum irradiance of 600 W/m² for category 1 inspection. Inspection at low irradiance (overcast, early morning) produces clean imagery of a solar farm in which most defects are not thermally distinguishable.
Wind: high wind cools the panel surface and reduces the temperature differential of defects. Most operating standards specify a maximum wind speed (typically 6–8 m/s) for inspection.
Time of day and sun angle: inspection is typically scheduled mid-morning to mid-afternoon, with the sun angle high enough that the panel is not in self-shading and low enough that reflective glare is manageable.
Equipment: radiometric (not just thermal-visualisation) cameras of appropriate resolution. Consumer-grade thermal sensors can produce striking imagery but are limited for defect classification at scale.
Operator training: thermal interpretation under solar conditions is a specific skill set. Anomaly classification, false-positive screening, and condition documentation depend on the operator understanding the physics of the asset, not just the imagery.
“Thermal drone inspection of a solar farm under good conditions produces an enormously useful defect map,” says Hunter Gray, founder of Overwatch Mapping. “The same flight under poor conditions produces an imagery archive with anomalies that may or may not represent real defects. The operating standard exists because the gap between those two outcomes is wide. We do not run thermal solar work outside the standard, and we recommend operators ask any provider how their flights meet IEC 62446-3.”
Where the program lands inside O&M
A thermal drone inspection program is most valuable when it integrates with the operator’s existing O&M workflow. The integration typically looks like:
- Annual or semi-annual full-site inspection producing a comprehensive defect map.
- Defect classification and severity ranking from the analysis software, with site, string, and module-level identification.
- Work order generation in the O&M system, with each defect linked to an asset record and ranked by severity and production impact.
- Verification capture following remediation work to confirm the defect has been resolved.
- Year-over-year comparison identifying defect emergence patterns and prioritising warranty discussions.
The integration with the operator’s asset management system is what determines whether the program drives O&M priority or sits alongside it. A defect map that lands in the O&M platform as ranked work orders is operationally complete. A defect map that lands as a PDF report needs the O&M team to do the integration work themselves, and the program loses momentum.
“The pattern we see in solar O&M is that the operators who put the work in to integrate the thermal capture with their CMMS get full value within a year,” Gray notes. “The operators who treat the thermal program as a separate annual exercise see less of the value, and tend not to renew at the same cadence. The integration is the multiplier.”
Where the program is regularly mis-scoped
Three common mis-scopes show up enough to be worth flagging:
Inspection cadence too low for the asset age. New solar farms have low defect emergence rates and can run on annual cadence. Older sites, particularly those with known cell-level issues or PID concerns, often benefit from semi-annual cadence to catch defect progression before it materially affects production.
Inspection without baseline visible-light imagery. A thermal-only deliverable forces the analyst to interpret thermal patterns without confirming the visible state. Every modern thermal solar program should pair thermal imagery with synchronised RGB imagery for context.
Defect classification without severity ranking. A flat list of 3,000 anomalies is operationally unmanageable. The deliverable should rank defects by production impact, safety implication, and remediation cost — so the O&M team knows what to action this week and what to schedule for the next outage.
The best-run programs we see specify severity ranking and integration with the CMMS in the original scope of work, not as a follow-up project.
A practical specification for solar thermal drone work
When commissioning a thermal drone program for a solar farm, the scope should address:
- Site list and capacity — informs cadence and per-site flight planning.
- Inspection cadence — annual or semi-annual, with rationale.
- Capture conditions standard — typically IEC 62446-3:2017 Category 1, with minimum irradiance, maximum wind, time-of-day window.
- Equipment specification — radiometric thermal camera, RGB pairing, minimum ground sample distance.
- Defect categorisation — module-level, string-level, BoS, with severity ranking criteria.
- Deliverable format — defect map georeferenced to the site layout, with module-level identification.
- Integration target — CMMS or O&M platform, with API or import path defined.
- Verification provisions — re-fly of remediated areas to confirm resolution.
- Annual comparison report — year-over-year defect emergence and progression analysis.
A scope that addresses these turns into a program that drives O&M priority, supports warranty conversations with module suppliers, and produces a continuous record of site condition. A scope that addresses only the flight produces imagery that needs internal effort to convert into work — and the conversion often does not happen at the pace the production impact would justify.
For solar operators, thermal drone inspection is one of the rare cases where the technology has matured ahead of the typical operator’s integration. The flights are cheap and reliable; the value is in how the data lands inside the O&M system. Scoping that integration in from the start is what separates the programs that compound value from the programs that produce annual reports.