3D Models and Point Clouds from Drone Photogrammetry: A Working Guide for Engineering Teams
What drone-derived 3D models and point clouds actually deliver for engineering and asset teams — accuracy, formats, fit against LiDAR, and where the outputs sit between visualisation and survey-grade data.
3D models and point clouds from drone photogrammetry have moved into mainstream engineering workflows over the last few years. Asset teams use them for site visualisation, terrain modelling, volume calculations, and as a base layer for design context. But the deliverables vary widely in accuracy and fitness for purpose, and the technology is often described in ways that overstate or understate what it can do.
This post is a working guide for engineering and asset teams: what the outputs actually are, what accuracy to expect, when photogrammetry is the right tool and when LiDAR is, and what to specify before commissioning a project.
What a drone-derived point cloud actually is
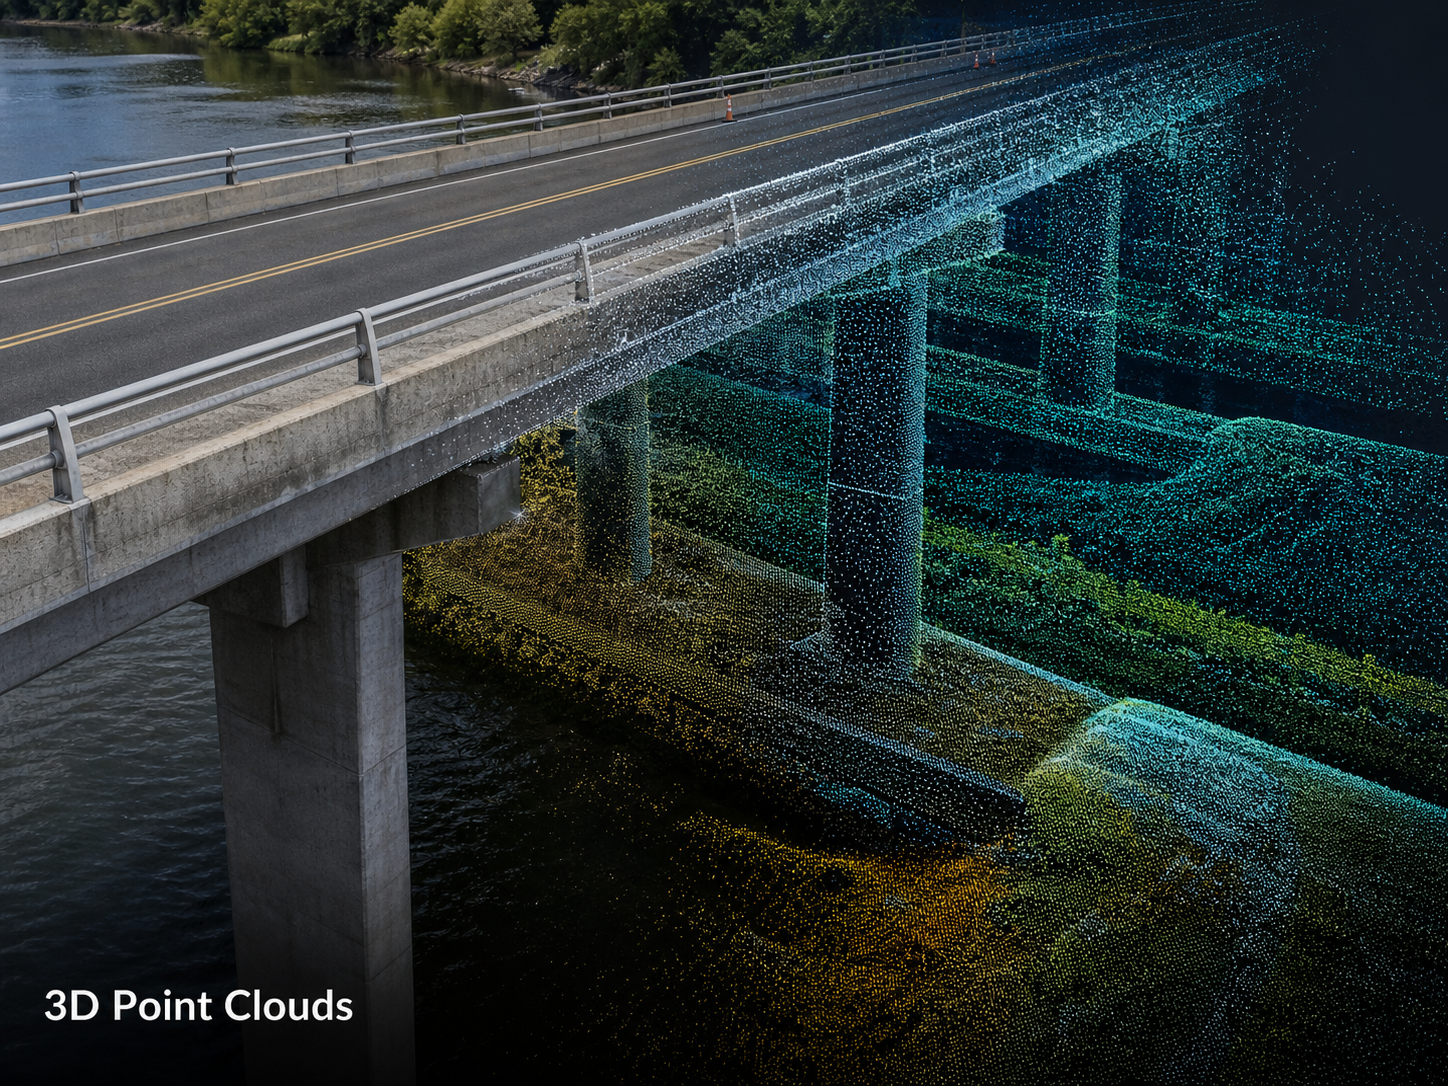
A photogrammetric point cloud is a dense collection of 3D points generated from overlapping aerial photographs. Each point has X, Y, and Z coordinates, and typically a colour value carried from the source imagery. The software identifies matching features across multiple images, calculates camera positions, and triangulates the position of each visible point in 3D space.
The result is a model of the visible surface of the site — terrain, structures, vegetation tops, anything the camera can see. It is fundamentally different from a LiDAR point cloud in two important ways: it cannot see through vegetation to ground beneath, and it is derived from visible-light imagery rather than direct distance measurement.
“When we hand a client a point cloud, the first conversation is about what they are going to do with it,” says Hunter Gray, founder of Overwatch Mapping. “Volume calculations, design context, and site visualisation are usually fine. Detailed structural analysis under tree canopy is not — we will recommend LiDAR for that, even if it is a more expensive flight.”
The match between the deliverable and the decision the engineering team is making is what determines whether the project is useful.
Accuracy expectations
Drone photogrammetry achieves centimetre-level accuracy under the right conditions. Academic studies and commercial benchmarks consistently report:
- Horizontal accuracy: 1 to 2 cm with RTK or PPK GNSS correction and well-distributed ground control points.
- Vertical accuracy: 2 to 5 cm under the same conditions. Vertical is always weaker than horizontal in photogrammetry; this is intrinsic to the geometry, not a software issue.
- Point density: typically tens to hundreds of points per square metre, depending on flight altitude, camera resolution, and overlap.
Achieving the upper end of this accuracy requires three things that often get under-specified: appropriate ground control, RTK/PPK aircraft, and post-flight processing with a qualified operator. A flight without ground control and with consumer-grade positioning may produce a visually compelling model with horizontal accuracy in the metre range — fine for visualisation, useless for engineering.
For most engineering use cases, the right specification language is survey-grade (centimetre, with documented checkpoints) or mapping-grade (sub-metre, sufficient for context and visualisation). Treating these as the same is the most common source of disappointed clients.
Photogrammetry versus LiDAR — when each is right
The two technologies coexist because they solve different problems.
Photogrammetry is the right choice when:
- The site has open or sparsely vegetated terrain.
- The deliverable is for visualisation, volume calculation, surface modelling, or design context.
- High point density across the visible surface matters more than ground penetration.
- Cost-effectiveness is a constraint — photogrammetry is typically significantly cheaper than LiDAR for comparable site coverage.
- The output benefits from natural-colour information for visual interpretation.
LiDAR is the right choice when:
- The site has significant vegetation and you need ground beneath it (transmission corridor work is the classic example).
- Survey-grade vertical accuracy is required across the entire site, not just at checkpoints.
- Time-of-day or lighting conditions prevent reliable photographic capture.
- Repeatability across multiple captures over time is critical and the canopy is changing seasonally.
“Photogrammetry will produce a stunning model of a substation yard. It will produce a misleading model of a forested transmission corridor,” Gray notes. “We have a default — if there is meaningful canopy and the deliverable affects clearance or terrain decisions, we recommend LiDAR. The cost difference is justified by the data being trustworthy.”
For 99% of sitework and mining applications, photogrammetry is the more cost-effective option. For corridor vegetation work and dense-canopy terrain modelling, LiDAR is usually the better fit.
Deliverable formats and what to specify
A typical photogrammetry project produces several related deliverables, and the right specification depends on the downstream user.
Orthomosaic (GeoTIFF) — the 2D geo-referenced image map, useful as a base layer in GIS and the most-used deliverable for non-3D workflows.
Digital Surface Model (DSM) — a raster representation of the surface elevation, useful for terrain visualisation and surface-based calculations.
Digital Terrain Model (DTM) — bare-earth elevation, generated by filtering vegetation and structures from the DSM. Filtering is imperfect from photogrammetry and should be reviewed for any engineering use.
Point cloud (LAS or LAZ) — the underlying 3D data, importable into engineering and BIM software.
3D mesh (OBJ, FBX, GLB) — a continuous surface model with texture, useful for visualisation, web viewers, and design-review presentations.
For engineering hand-off, the format specification needs to match the receiving software. CAD platforms typically accept LAS or LAZ point clouds. BIM platforms increasingly accept OBJ or FBX meshes. Web-based visualisation usually wants GLB or 3D Tiles. Specifying the format alongside the coordinate reference system before the flight prevents a re-export step that can introduce data loss.
Coordinate reference systems matter more than people expect
A surprisingly common source of project rework is a coordinate reference system (CRS) mismatch between the delivered data and the receiving engineering platform. Drone data is usually captured in WGS84 (a geographic CRS); engineering platforms typically work in a local projected CRS — a State Plane zone, UTM zone, or a project-specific grid.
Re-projection is a routine operation but introduces small accuracy losses, particularly in vertical datum (NAVD88 versus ellipsoid heights, or local geoid models). For survey-grade deliverables, the CRS should be agreed at scoping, and the deliverable should arrive in the receiving platform’s CRS, not in the capture CRS with a note about how to re-project.
A useful specification line in any RFP or scope of work:
“Deliverables will be provided in [target CRS, horizontal and vertical], with documented transformation parameters from capture CRS. A geo-referenced ground control report will accompany the delivery.”
Where 3D models add the most engineering value
Three categories of work consistently get strong value from photogrammetric 3D data.
Volume calculations — stockpiles, cut-and-fill estimates, and earthworks progress. Drone-derived volumes routinely come within 1 to 3% of survey-grade ground truth on well-controlled flights, at a fraction of the cost of total-station survey.
As-built documentation — capturing the actual built condition of a structure or site, comparable against design drawings. The 3D model becomes a working reference for retrofit and modification work.
Site visualisation for design and review — providing a navigable 3D context for engineering decisions, particularly useful when stakeholders are distributed and site visits are expensive.
The category where photogrammetric 3D data adds less value than people expect is detailed inspection — fine cracks, corrosion patterns, and structural detail. The model is a context layer; the inspection imagery sits alongside it.
A final note on the next twelve months
The interesting development in this space is the combination of photogrammetry with AI-based modelling techniques, particularly neural radiance field (NeRF) approaches and machine-learning-assisted mesh generation. Early benchmarks suggest meaningful improvements in mesh quality for visualisation, though traditional photogrammetry remains the right choice for engineering-grade metric outputs today.
“We will adopt the new techniques as the accuracy stories firm up,” Gray says. “For now, the engineering deliverables we hand over are produced by photogrammetry or LiDAR that has been benchmarked against ground truth. Visualisation is moving faster than measurement is — we keep those two conversations separate.”
For engineering teams commissioning drone 3D work, the questions to lead with are: what decision will this data support, what accuracy does that decision require, and what format does the receiving platform need. The technology can produce excellent answers to those questions when they are asked first.